Editor’s Pick: Temporal Trends in Childhood Type 1 Diabetes in the East Midlands, UK (2010–2024)

Key Points
1.Contemporary longitudinal data describing childhood Type 1 diabetes presentation in the East Midlands are limited, while temporal patterns vary between regions.
2. This was a 15-year registry study of 1,678 children aged 0–14 years diagnosed with Type 1 diabetes across 11 young person’s diabetes clinics between 2010–2024.
3. Diabetic ketoacidosis was common among children with analysable pH, while age and HbA1c differed across years and seasonal variation in recorded diagnoses was modest.
BACKGROUND
The incidence of childhood Type 1 diabetes has increased substantially across Europe over recent decades, although temporal patterns vary between populations. A recent systematic review and meta-analysis of European studies from 1994–2022 found an overall increase in incidence alongside substantial between-country variation in temporal trends.1 Longer-term European registry data have similarly demonstrated substantial heterogeneity in temporal patterns, including evidence of slowing or levelling in some centres.2 In Sweden, incidence has remained at a relatively stable high level since approximately 2005, while Finland experienced a plateau followed by a decline, particularly among younger children.3,4 Recent data from Wales have similarly demonstrated a non-linear pattern, with incidence peaking and subsequently declining.5 These contrasting trends highlight the importance of contemporary regional surveillance rather than assuming that historical increases have continued uniformly across populations.
Within the UK, registry-based studies have demonstrated regional variation in childhood Type 1 diabetes patterns. Recent analyses from North East England and North Cumbria have examined temporal changes in incidence, demographic characteristics, and clinical presentation, while longitudinal Welsh data have identified changing incidence and seasonal variation.5,6 However, longitudinal analyses describing changes in diagnostic characteristics and seasonal patterns among children with newly diagnosed Type 1 diabetes specifically within the East Midlands are limited. National Paediatric Diabetes Audit data provide important regional information on children and young people with diabetes, but the East Midlands registry additionally permits longitudinal description of clinical characteristics recorded at diagnosis and month-of-diagnosis patterns over an extended period.7 The East Midlands is a large and demographically diverse region, and regional analysis may therefore provide information relevant to local service planning and comparison with other UK populations.
Seasonal variation in Type 1 diabetes diagnosis has been repeatedly reported and may provide clues to time-varying environmental influences, although the mechanisms remain uncertain.5,8 The present study uses data from the East Midlands Young Persons Diabetes Registry to describe temporal and seasonal patterns in recorded diagnoses and clinical presentation among children aged 0–14 years between 2010–2024. Specifically, the authors examined variation by age and sex and changes in HbA1c, blood glucose, pH, and other characteristics at diagnosis.
METHODS
Study Population and Registry Coverage
The East Midlands Young Persons Diabetes Registry recruits children and young people diagnosed with diabetes before 18 years of age from 11 young persons diabetes clinics across the East Midlands. For the present study, analyses were restricted to children aged 0–14 years to facilitate comparison with established childhood Type 1 diabetes epidemiological studies and regional registry analyses using this age range. Children with Type 1 diabetes diagnosed between January 2010 and December 2024 were included.
Consent
For participants aged under 16 years, informed consent is provided by a parent or legal guardian. Children aged 10–15 years are additionally asked to provide assent. Young people aged 16–17 years provide their own informed consent. Consent and assent are typically sought during clinical appointments or shortly after diagnosis. Patients and families are provided with written information about the registry and given time to consider participation. Once appropriate consent and, where applicable, assent have been obtained, routinely collected clinical and demographic information is extracted from hospital records by clinical staff and transferred securely to the registry. In cases where consent is declined, a minimal, anonymised dataset may be retained for audit and surveillance purposes only. All identifiable information is removed prior to analysis. The present study used consented registry data only.
Data Quality and Governance
On receipt at Newcastle University, UK, registry data and consent information were cross-checked for consistency, and discrepancies were referred back to the contributing clinics for clarification and resolution. Information on clinic-specific data-quality procedures and whether these procedures changed during the 2010–2024 study period was not available. The registry operates according to a protocol approved by the North East Newcastle and North Tyneside 1 Research Ethics Committee on 6 June 2022, which governs recruitment, consent, data collection, and use. The registry is enrolled within Newcastle University’s Data Security and Protection Toolkit framework for health research, which provides governance for the secure storage, access, and handling of patient data, including restriction of access to authorised personnel.
Statistical Analysis
The principal outcomes of interest were age and clinical characteristics at diagnosis, including HbA1c, blood glucose, pH, and diabetic ketoacidosis (DKA) status. BMI standard deviation score (BMI-SDS) and birthweight were also examined as descriptive characteristics. Sex, ethnicity, and DKA were summarised using counts and percentages, while age, BMI-SDS, birthweight, HbA1c, blood glucose, and pH were summarised using medians and interquartile ranges because their distributions were non-normal. Deprivation was assessed by mapping residential postcodes at diagnosis to lower-layer super output areas and linking these to the corresponding Index of Multiple Deprivation (IMD). Lower-layer super output areas were classified according to nationally derived IMD quintiles, with quintile 1 representing the most deprived 20% of areas nationally and quintile 5 the least deprived 20%.9
Missing clinical data were not imputed, and analyses were conducted using available observations for each variable. HbA1c and blood glucose were included in quantitative analyses where a positive numeric value was recorded; non-numeric entries were excluded. Predefined plausibility restrictions were applied to birthweight (900–5,000 g) and pH (6–8). BMI was calculated as weight in kilograms divided by height in metres squared using measurements recorded at diagnosis where both were available. BMI-SDS was calculated using age- and sex-specific UK-WHO reference data, and values outside −5–+5 were excluded as implausible.10,11 The number of analysable observations for each clinical variable is reported in Table 1. As continuous variables were non-normally distributed, differences in age, birthweight, BMI-SDS, HbA1c, blood glucose, and pH across calendar years were assessed using Kruskal-Wallis H (H) tests. The magnitude of temporal differences was described using year-specific medians and interquartile ranges.
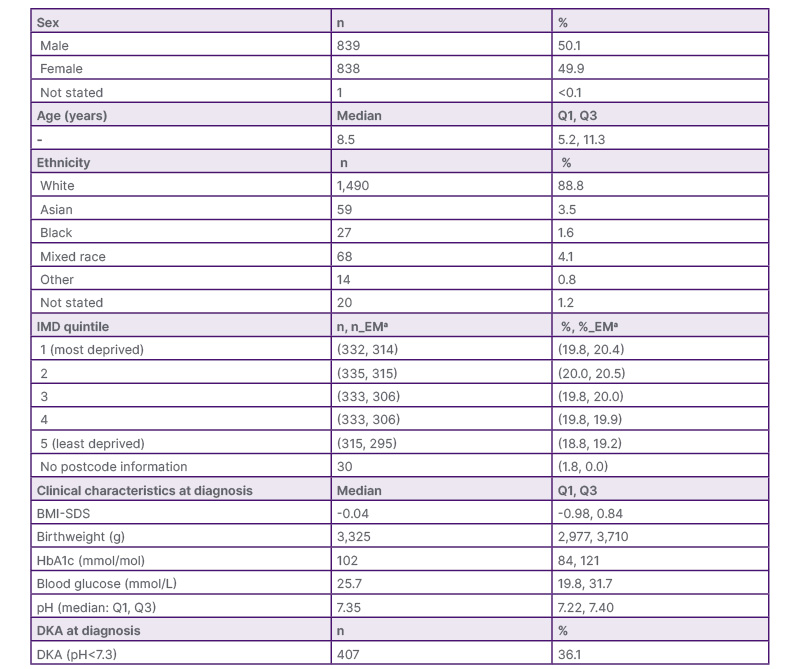
Table 1: Characteristics of 1,678 children aged 0–14 years diagnosed with Type 1 diabetes in the East Midlands registry, 2010–2024.
aBased on residential postcode at time of diagnosis.
BMI-SDS (between -5–5) n=836; birthweight (restricted to 900–5,000 g) n=1,223; HbA1c n=1,503; blood glucose n=1,334; pH (6-8) n=1,126.
BMI-SDS: BMI standard deviation score; DKA: diabetic ketoacidosis; IMD: Index of Multiple Deprivation; EM: East Midlands postcode.
To investigate seasonal variation, the number of recorded diagnoses was aggregated by calendar month across the study period. Poisson regression models were fitted with month represented by sine and cosine terms with a 12-month period. Separate sex-adjusted and age-group-adjusted models were fitted. Likelihood-ratio tests compared models with and without the harmonic terms to assess the overall contribution of seasonality. Overdispersion was assessed using the Pearson dispersion statistic, and quasi-Poisson models were fitted as sensitivity analyses to assess the robustness of the seasonal findings where overdispersion was present. All tests were two-sided, with p<0.05 considered statistically significant. Statistical analyses were performed using Posit PBC (Boston, Massachusetts, USA).
RESULTS
Demographic Summary
Between January 2010 and December 2024, a total of 1,678 children aged 0–14 years were diagnosed with Type 1 diabetes and included in the analysis. Table 1 presents the demographic and baseline clinical characteristics of the registry population. The sex distribution was approximately equal, and the median age at diagnosis was 8.5 years (interquartile range [IQR]: 5.2–11.3). Most children were of White ethnicity (88.8%), with smaller numbers of Mixed (4.1%), Asian (3.5%), Black (1.6%), and Other (0.8%) ethnic backgrounds.
Of the 1,678 participants, 1,536 had an East Midlands residential postcode at diagnosis, 112 had a postcode outside the region, and postcode information was unavailable for 30. Across the full cohort, the proportions in nationally derived IMD quintiles 1–5 were 19.8%, 20.0%, 19.8%, 19.8%, and 18.8%, respectively. Among those with an East Midlands postcode, the corresponding proportions were 20.4%, 20.5%, 20.0%, 19.9%, and 19.2%. The proportions of cases in the registry by IMD quintile are comparable to the East Midlands data from the National Paediatric Diabetes Audit (NPDA).
At diagnosis, valid BMI-SDS was available for 836 children, with a median of −0.04 (IQR: −0.98–0.84). This is close to zero, corresponding approximately to the 50th centile and indicating that the median BMI was close to the age- and sex-specific reference median.11 Median birthweight among 1,223 children with analysable values was 3,325g (IQR: 2,977–3,710). HbA1c was analysable for 1,503 children (median 102 mmol/mol; IQR: 84–121), and blood glucose for 1,334 (median 25.7 mmol/L; IQR: 19.8–31.7). pH was recorded for 1,137 children (67.8%); following restriction to the predefined plausible range of 6–8, 1,126 values were retained for analysis. Median pH was 7.35 (IQR: 7.22–7.40). Among patients with analysable pH, 407/1,126 (36.1%; 95% CI: 33.4–39.0%) presented with DKA (pH <7.3). Of these, 152 (37.3%) had severe (pH < 7.1), 94 (23.1%) moderate (pH 7.10–7.19), and 161 (39.6%) mild DKA (pH 7.20–7.29).12
Temporal comparisons over the 15-year study period are presented in Table 2. Age at diagnosis differed across calendar years (H=120.41; p<0.01). Median age increased descriptively from 5.1 years in 2010 to over 9 years from 2017 onwards, reaching 10.6 years in 2024. However, the age composition of registry participants also changed over time, with relatively greater representation of children aged 10–14 years and lower representation of those aged 0–4 years in later years; the observed pattern should therefore not be interpreted as evidence of a population-level change in age at diagnosis. HbA1c also differed across calendar years (H=34.34; p=0.002); annual medians ranged from 92 mmol/mol in 2011 to 109 mmol/mol in 2024, although the 2024 estimate was based on only 16 observations. BMI-SDS also differed across years (H=25.68; p=0.028), but showed no consistent directional pattern. Birthweight, blood glucose, and pH did not differ significantly across years. Excluding 2024 did not materially alter these findings: differences across years remained evident for age, HbA1c, and BMI-SDS, whereas birthweight, blood glucose, and pH remained non-significant.
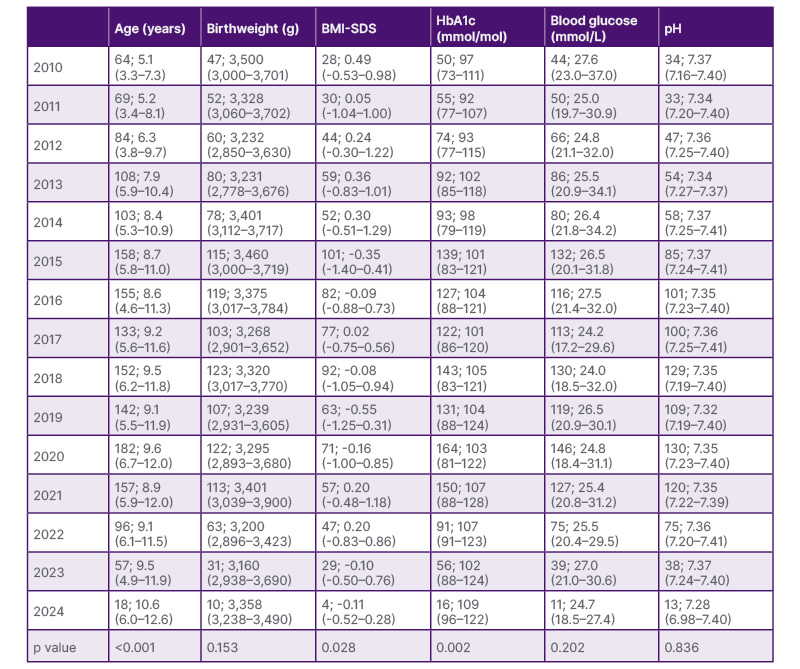
Table 2: Age, BMI-SDS, HbA1c, blood glucose, pH, and birthweight at diagnosis by year (n: median [Q1, Q3]).
BMI-SDS: BMI standard deviation score.
Type 1 Diabetes Cases by Sex and Age Group
Recorded case counts showed broadly similar temporal patterns in males and females, with higher numbers from the mid-2010s, a maximum in 2020 (94 females and 88 males), and lower counts thereafter. The age distribution changed substantially over the study period. In 2010, 32 cases were aged 0–4 years, 31 were aged 5–9 years, and only one was aged 10–14 years. By 2020, the corresponding counts were 25, 71, and 86, respectively. From the mid-2010s onwards, the 10–14-year group contributed an increasing proportion of recorded cases, whereas the number of diagnoses among children aged 0–4 years was comparatively stable before declining in later years.
HbA1c
Annual mean HbA1c showed an overall tendency towards higher values in later years, although there was considerable year-to-year variation. Mean HbA1c was generally higher among females than males, although this pattern was not consistent in every year (Figure 1A). Across age groups, mean HbA1c was generally highest among children aged 10–14 years (approximately 98–113 mmol/mol), intermediate among those aged 5–9 years (93–108 mmol/mol), and lowest among those aged 0–4 years (84–112 mmol/mol), although these patterns were not present in every year (Figure 1B). The high mean HbA1c of 112 mmol/mol among children aged 0–4 years in 2024 was based on only three observations and should therefore be interpreted cautiously.
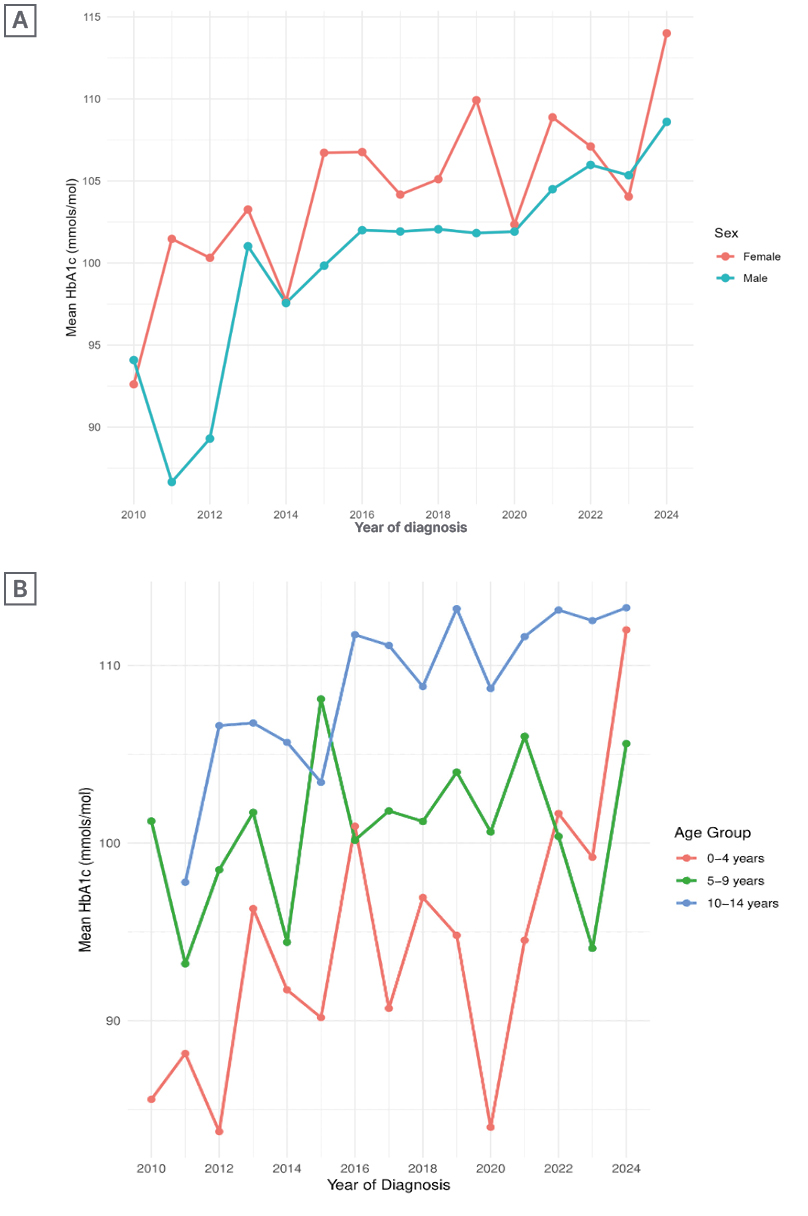
Figure 1: Mean HbA1c at diagnosis.
A) Mean HbA1c at diagnosis by sex. B) Mean HbA1c at diagnosis by age group.
Blood Glucose
Mean blood glucose concentrations varied over the study period, with no clear consistent temporal pattern. Among females, annual means ranged from 23.7–28.3 mmol/L through 2023, while among males they ranged from 24.3–31.6 mmol/L; the lower male mean in 2024 (21.4 mmol/L) was based on only seven observations. Across age groups, greater year-to-year variability was observed among children aged 0–4 years, with annual mean glucose ranging from approximately 23–31 mmol/L and exceeding 28 mmol/L in several years. Mean values were less variable among children aged 5–9 and 10–14 years.
pH
Annual mean pH values fluctuated around the diagnostic threshold for DKA throughout the study period and were broadly similar between males and females overall. Through 2023, annual mean pH ranged from 7.18–7.32 in females and from 7.21–7.32 in males, with a lower male mean observed in 2016 (7.21) (Figure 2A). Greater year-to-year variability was evident among children aged 0–4 years, with annual means ranging from approximately 7.16–7.35 through 2023, whereas values in the older age groups were more stable (Figure 2B). The lower mean pH observed in the 0–4-year group in 2024 (6.84) was based on only three observations.
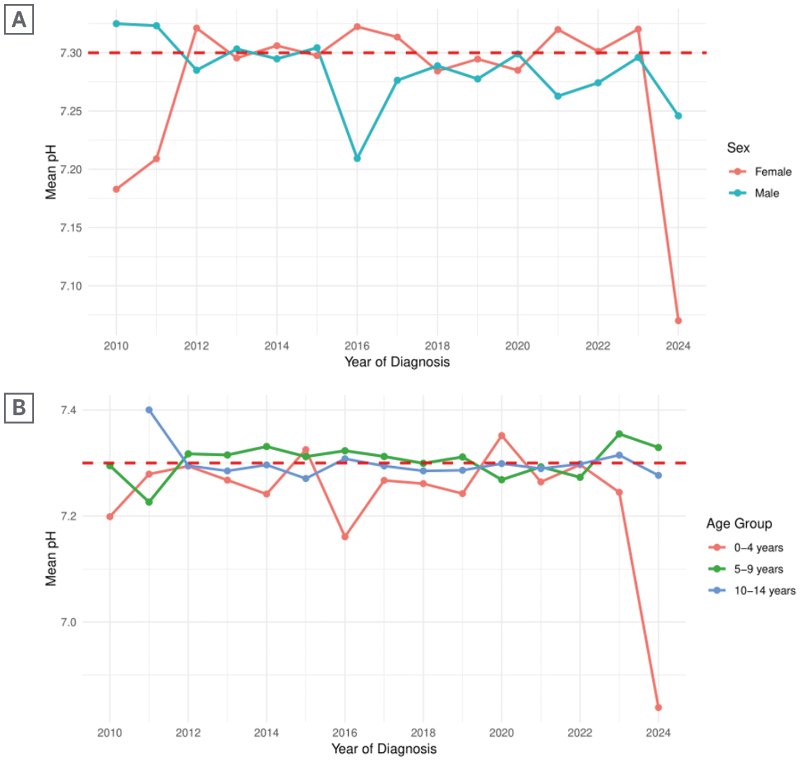
Figure 2: Mean pH at diagnosis.
A) Mean pH at diagnosis by sex. B) Mean pH at diagnosis by age group.
Associations with DKA and Other Clinical Variables
Comparisons between children presenting with and without DKA were made using Wilcoxon rank-sum tests. Children presenting with DKA were slightly younger than those without DKA (median 8.58 versus 8.93 years; p=0.043), although the absolute difference was small. Birthweight and BMI-SDS distributions were similar between children with and without DKA (birthweight: 3316 versus 3345g; p=0.679; BMI-SDS: −0.105 versus −0.059; p=0.114). In contrast, children presenting with DKA had higher HbA1c (median 110 versus 101 mmol/mol; p<0.001) and blood glucose concentrations (27.0 versus 25.0 mmol/L; p=0.004).
In Spearman correlation analyses using pairwise available observations, BMI-SDS was inversely correlated with HbA1c (ρ=−0.249; n=799; p<0.001) and blood glucose (ρ=−0.169; n=655; p<0.001). HbA1c was positively correlated with blood glucose (ρ=−0.249; n=1,270; p<0.001) and inversely correlated with pH (ρ=−0.197; n=1,079; p<0.001); blood glucose was also weakly inversely correlated with pH (ρ=−0.113; n=1,091; p<0.001). Birthweight showed little evidence of association with the metabolic parameters examined.
Seasonality by Month of Diagnosis
Monthly diagnosis counts showed modest variation across the calendar year. Among males, the highest recorded cases occurred in January (n=99) and September (n=86), while among females the highest counts occurred in February (n=81) and August (n=80). Among children aged 0–4 years, higher counts were observed in January, March, and October; those aged 5–9 years showed higher counts around February–March and August–September; and the pattern was less distinct among those aged 10–14 years, with the highest number of cases occurring in August.
Harmonic Poisson models estimated a similar annual-cycle amplitude in the sex-adjusted and age-group-adjusted analyses, corresponding to an approximately 17% fitted peak-to-trough difference in monthly recorded diagnosis counts. However, addition of the joint sine and cosine terms did not significantly improve model fit in either the sex-adjusted model (likelihood-ratio test: p=0.079) or the age-group-adjusted model (p=0.084). Although the cosine coefficient was individually significant in both models (p=0.024 and p=0.026, respectively), the sine and cosine terms were interpreted jointly as the primary test of seasonality. Pearson dispersion statistics were 1.64 and 1.19, respectively, indicating moderate overdispersion in the sex-adjusted model and mild overdispersion in the age-group-adjusted model. Evidence for a joint seasonal effect was further attenuated in quasi-Poisson sensitivity analyses (sex-adjusted: p=0.237; age-group-adjusted: p=0.142). Overall, the observed monthly counts suggested modest seasonal variation, but evidence for a consistent annual cyclical pattern was limited.
To assess whether seasonal patterns differed by age group, an additional model incorporating interactions between age group and the sine and cosine harmonic terms was fitted. Although the late-summer concentration appeared greater in the 5–9 and 10–14-year age groups, there was no evidence that the annual seasonal pattern differed by age group (p=0.242).
DISCUSSION
This regional analysis of 1,678 children diagnosed with Type 1 diabetes between 2010–2024 provides a description of diagnostic characteristics recorded in the East Midlands Young Persons Diabetes Registry. The sex ratio was almost equal, consistent with most UK registry data, but contrasting with some European reports of a slight male predominance, particularly in adolescence.13 The median age at diagnosis was 8.5 years, aligning with previous studies reporting peak onset between 7–9 years.14 The ethnic distribution of cases with an East Midlands postcode reflected the demographic composition of the East Midlands, with the majority of cases among White children. However, the relatively low representation of minority ethnic groups limited the ability to reliably assess DKA presentation or other diagnostic characteristics by ethnicity. Early research suggests that children of Black and South Asian heritage are more likely to present with DKA and higher HbA1c levels at diagnosis.15 Future linkage of multi-registry data with socioeconomic indicators could help clarify whether ethnic inequalities exist regionally.
Among the 836 children with valid BMI-SDS data, the median BMI-SDS at diagnosis was −0.04, close to the centre of the UK-WHO reference distribution. Most were within the healthy-weight category (76.4%), with a combined overweight or obesity prevalence of 15.6%. This is somewhat surprising given hypotheses that higher adiposity may accelerate β-cell failure and disease onset.16 These findings also contrast with data from the NPDA, which reports that 42% of children and young people with Type 1 diabetes fall into the overweight or obese category.7 However, direct comparison is limited because BMI in the present study was measured at diagnosis, when acute pre-diagnostic weight loss, catabolism, and dehydration may have influenced body weight, whereas NPDA estimates largely reflect children already receiving ongoing diabetes care. BMI-SDS did not show a consistent directional pattern over time, despite evidence of a difference across calendar years. BMI-SDS was modestly inversely correlated with HbA1c and blood glucose, but did not differ significantly between children presenting with and without DKA. Birthweight was also similar between those with and without DKA and showed little evidence of association with metabolic parameters at diagnosis, despite suggestions that higher birthweight may increase risk through fetal overnutrition and β-cell stress.17
Of the 1,126 children with valid pH measurements, 407 (36.1%) presented with DKA at diagnosis, indicating a substantial burden of acute metabolic decompensation among children in whom pH was available. Median HbA1c at diagnosis was 102 mmol/mol, consistent with substantial preceding hyperglycaemia in many children. These findings support the continued importance of timely recognition of Type 1 diabetes symptoms and awareness initiatives such as Diabetes UK’s 4Ts campaign, which promotes recognition of the symptoms Toilet, Thirsty, Tired, and Thinner.18,19
HbA1c differed across calendar years, with higher median values in some later years, including 2021–2022. Similar changes in metabolic presentation during the COVID-19 pandemic have been reported elsewhere.7,20,21 However, the present observational data cannot determine whether the differences observed in this registry were caused by pandemic-related healthcare disruption, delayed presentation or other factors. Blood glucose and pH did not differ significantly across calendar years. Median age at diagnosis also increased across the study period, from approximately 5 years in 2010 to over 9 years in later years. This finding requires particular caution, because the age composition of the registry changed substantially over time, including increasing representation of children aged 10–14 years. The apparent age shift therefore cannot be interpreted as evidence of a population-level change in age at onset and likely reflects, in part, changes in registry participation and case ascertainment.
Sex- and age-group analyses showed some heterogeneity in metabolic presentation. Annual mean HbA1c was generally higher among females than males, although this pattern was not consistent in every year. HbA1c was also generally highest among children aged 10–14 years, while younger children showed greater year-to-year variability in pH. Spearman analysis similarly demonstrated a modest positive association between age and HbA1c. These findings describe age- and sex-related differences within the registry, but the study was not designed to establish the biological or behavioural mechanisms underlying them.
Monthly diagnosis counts showed modest descriptive seasonal variation. Higher counts among younger children were observed in several colder months, while the late-summer elevation was most apparent among children aged 5–9 years; children aged 10–14 years also had their highest monthly count in August, although their overall seasonal pattern was less distinct. Therefore, the late-summer pattern appeared more evident among school-age children than among those aged 0–4 years. In harmonic regression, the fitted annual cycle corresponded to an approximately 17% peak-to-trough difference in monthly diagnosis counts. However, the joint sine and cosine terms did not significantly improve model fit in either the sex-adjusted or age-group-adjusted models, and evidence was further attenuated in quasi-Poisson sensitivity analyses accounting for overdispersion. The data therefore provide evidence of modest monthly variation but limited statistical evidence for a consistent annual cyclical pattern.
Both the persistently elevated HbA1c and the substantial rate of DKA imply that many children experience unrecognised hyperglycaemia for weeks or months before diagnosis. This delay likely arises from multiple interacting factors. For younger children, symptom ambiguity and misdiagnosis in primary care are well-documented barriers.22,23 For adolescents, social and behavioural factors (greater autonomy, denial, or delayed disclosure of symptoms) play a key role.24 Structural influences such as socioeconomic deprivation, healthcare access, and parental awareness also contribute, as demonstrated in national audits where children from deprived or minority backgrounds face higher DKA risk at diagnosis.25,26 In this study, socioeconomic deprivation was characterised using national IMD quintiles. Although DKA cases were observed across the deprivation distribution, the present descriptive analyses were not designed to estimate deprivation-specific risk of DKA. Further analyses with complete ascertainment and appropriate adjustment would be needed to determine whether socioeconomic inequalities in presentation exist within this population.
The study’s strengths include its large multicentre registry cohort and 15-year coverage, enabling detailed description of temporal, demographic and clinical characteristics at diagnosis. Several limitations should be considered when interpreting the findings. Registry participation and the age distribution of recorded cases varied over time, meaning that changes in case counts and age at diagnosis may partly reflect changes in ascertainment. In addition, the registry was not a population-complete cohort and population denominators for the children served by the participating clinics were unavailable. As analyses were restricted to consented registry participants, population incidence rates could not be calculated and recorded case counts should not be interpreted as incidence.
Completeness of clinical data varied across measures. Diagnosis weight was available for 1,466 children (87.4%) and height for 882 (52.6%); because BMI-SDS required both measurements, valid age- and sex-standardised BMI-SDS values were available for 836 children (49.8%). Analysable data were available for 1,503 participants (89.6%) for HbA1c, 1,334 (79.5%) for blood glucose, 1,223 (72.9%) for birthweight, and 1,126 (67.1%) for pH. Analyses were therefore based on available observations for each variable, and estimates based on variables with greater missingness should be interpreted cautiously. In particular, pH may have been more likely to be measured when DKA was clinically suspected; consequently, the observed DKA proportion among children with analysable pH may be affected by indication bias and may not represent DKA prevalence across the entire cohort. The relatively small numbers of children from individual minority ethnic groups also limited ethnicity-specific analyses.
The findings highlight the continued importance of public and professional awareness of the early signs of Type 1 diabetes. The Diabetes UK 4Ts campaign and similar initiatives have sought to improve recognition of characteristic symptoms, and continued diagnostic vigilance remains important. Primary care practitioners should maintain a low threshold for blood glucose testing in children presenting with symptoms suggestive of Type 1 diabetes. From a surveillance perspective, complete and consistent reporting to regional and national diabetes registries is also important for monitoring diagnostic characteristics over time. Improved linkage between diabetes registries, primary care, and hospital datasets could strengthen case ascertainment, improve quality of clinical information, and facilitate evaluation of diagnostic patterns, inequalities and awareness initiatives. More complete population-based registry data would also enable more reliable estimation of incidence and support local service planning.
CONCLUSION
This study provides a 15-year description of children aged 0–14 years with Type 1 diabetes recorded in the East Midlands Young Persons Diabetes Registry. DKA was common among children with analysable pH, and HbA1c and age at diagnosis differed across calendar years, although interpretation of temporal changes is constrained by changes in registry participation and age composition. Most children with available BMI-SDS data were within the healthy-weight range at diagnosis. Monthly diagnosis counts showed modest seasonal variation, but statistical evidence for a consistent annual cyclical pattern was limited. Incomplete clinical data, reliance on consented registry participation, and the absence of population denominators preclude estimation of population incidence and limit inference about temporal trends. Continued awareness of the early signs of Type 1 diabetes, year-round diagnostic vigilance, and more complete and consistent registry reporting remain important for improving surveillance and reducing severe presentation at diagnosis.